In order to understand the silent key failure, I went through different steps to get more information.
The two halves of the keyboard
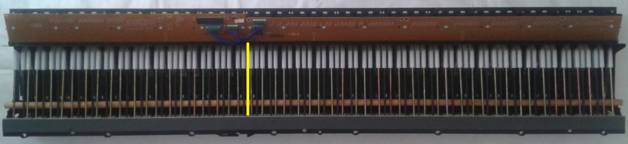
We see below the keyboard of our CLP-810s piano. Those keys that have failed are marked with a red dot. The blue line divides the keys in two sets: A0 to F#3 and G3 to C8:

Where does this blue line come from? And why all the keys to the right to the right of that line have never failed, including the frequently used keys at the center of the keyboard, like the octave from C4 to C5?
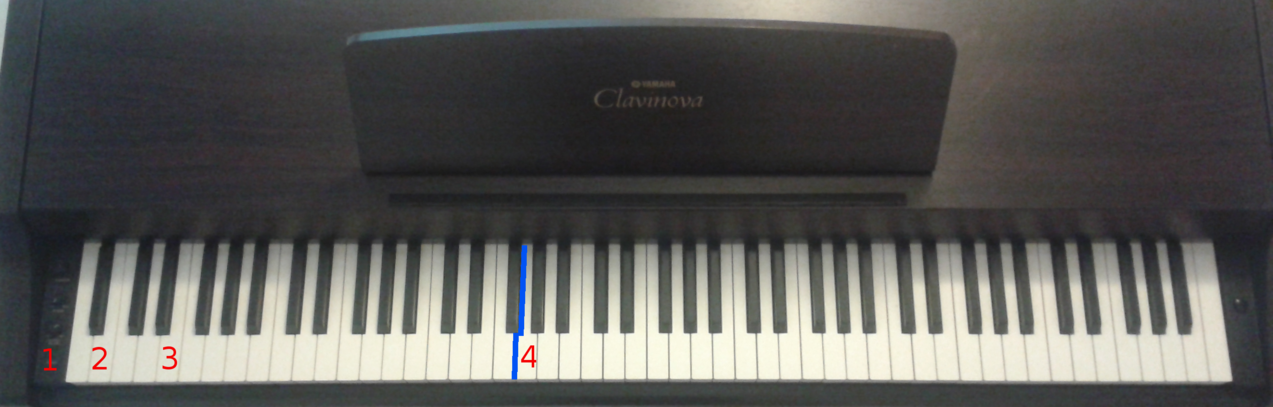
The blue line is defined by the two printed circuit boards that form the scanning circuitry. When we view the keyboard from the bottom, the yellow line is in the limit of both boards:
The printed circuit board on the left includes the scanner integrated circuit and the switches for the keys on the left side, forming the first 6 scan groups. The printed circuit board on the right has the switches for the keys on the right side, forming the last 9 scan groups. Two cable assemblies interconnect both printed circuit boards.
What is different that makes only keys on the left side fail?
To answer this question, we need to be able to measure the voltages in the keyboard scanner circuitry. A voltmeter cannot help us, because these voltages are constantly changing due to the scan mechanism. We need to use an oscilloscope, which actually displays the voltages across time.
Measurement setup
We are interested in the equivalent circuit of each key, and want to know the voltages in A and B on each side of the diode while the corresponding key is pressed:

A BitScope Micro oscilloscope was used with the following parameters and connections:
-
Horizontal sweep speed: 10 or 20 microseconds/division
-
Horizontal sweep trigger: The first output pin of the scanner integrated circuit, connected to the first digital input of the oscilloscope. This signal is shown in gray color in the pictures below, at the bottom of the lower half of the screen.
-
Analog inputs: The two analog inputs are connected to A and B above.
-
Vertical scale: 1 or 2 Volt/division.
-
Horizontal markers: They are adjusted to read the voltages Va and Vb, the oscilloscope displays the difference, Vf.
We call the two measured voltages Va (waveform shown in yellow) and Vb(waveform shown in green). These three values are calculated from the measured values, representing the switch as a resistor:
-
The forward voltage in the diode Vf = Va - Vb
-
The current I = (5V - Va) / 10 kΩ
-
The resistance of the switch R = Vb / I

Results
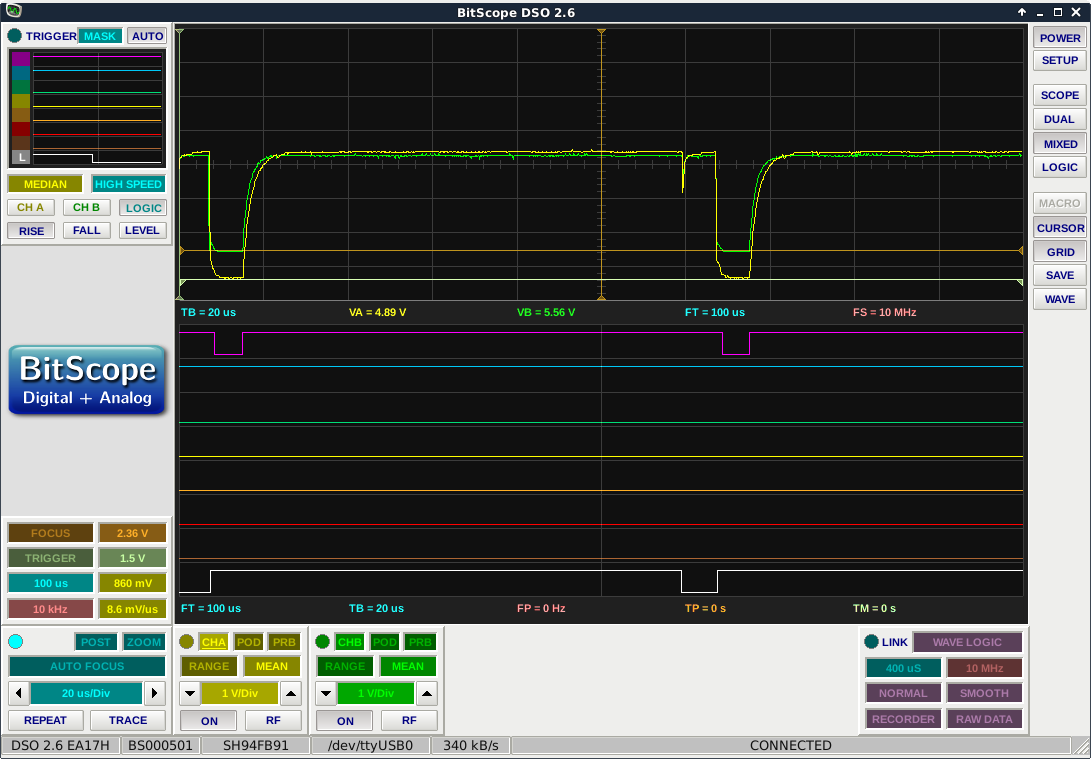
From the voltage readings that were done, three measurements from the left side and one from the right side are included here, shown numbered in the picture below:
-
First cell with jumper, it would correspond to key G0.
-
B0, the trace was taken after the key has warmed up and plays normal.
-
E1, the trace was taken when the key is silent.
-
G3, the first key in the right side.
1. First cell with jumper
Va = 560mV, Vb = 0V, Vf = 560mV, the jumper resistance is practically zero.

2. B0 key
Va = 1.84V, Vb = 1.32V, Vf = 520mV
I = (5 V- 1.84V) / 10,000 ohm = 0.316mA
R = 1.32V / I = 4,177 ohm

3. E1 silent key
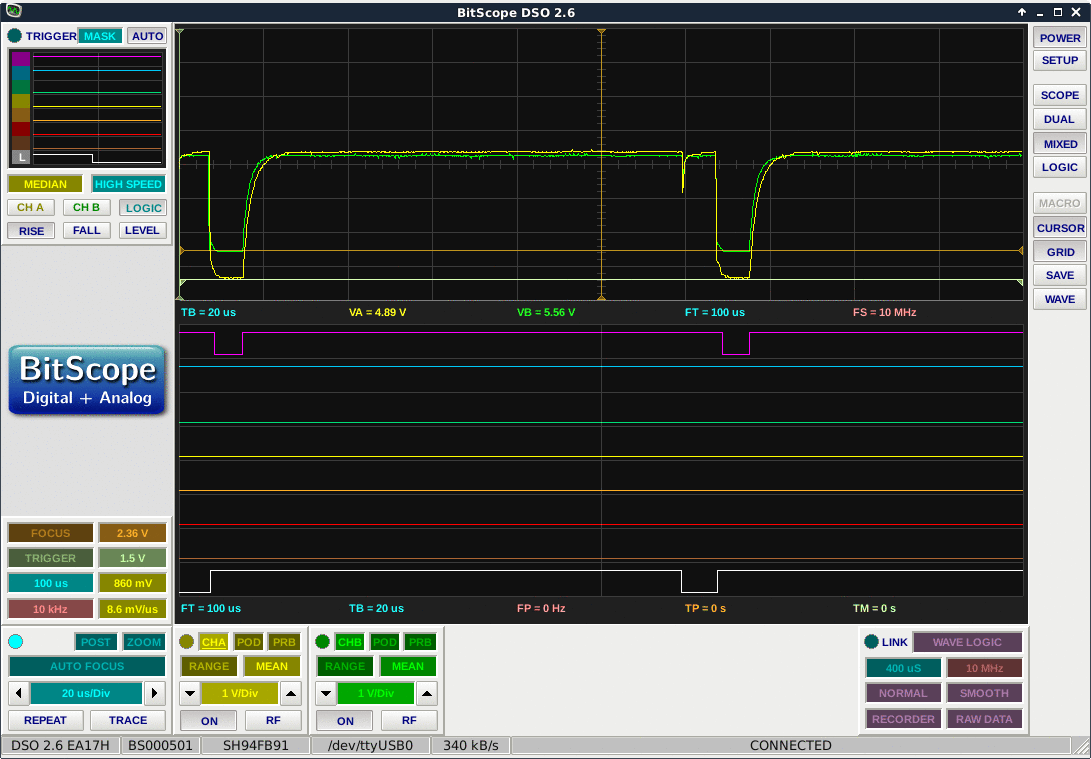
Va = 2.36V, Vb = 1.50V, Vf = 860mV
I = (5 V - 2.36V) / 10,000 ohm = 0.264mA
R = 1.50V / I = 5,682 ohm
4. G3 key
Va = 680mV, Vb = 40mV and Vf = 640mV
I = (5V - 0.680V) / 10,000 ohm = 0.432 mA
R = 0.040V / I = 92 ohm
Summary
The values from above are summarized here:
| Group | Va | Vb | Vf | I [mA] | R |
|---|---|---|---|---|---|
| 1. First cell with jumper | 0.560 | 0 | 0.560 | 0.444 | 0 |
| 2. B0 key | 1.84 | 1.32 | 0.520 | 0.316 | 4,177 |
| 3. E1 silent key | 2.36 | 1.50 | 0.860 | 0.264 | 5,682 |
| 4. G3 key | 0.680 | 0.40 | 0.640 | 0.432 | 92 |
The following pattern was found:
-
Keys on the right side have R values around 100 ohm.
-
Keys that play normal have R values 40 times larger, around 4,100 ohm.
-
Silent keys have R values 55 times larger, about 5,600 ohm. The resulting high Va is not interpreted as a logical 0.
-
The four cells with a jumper have voltages similar to the keys on the right side, we see that the scanner output is at ground voltage when active.
Resistance measurements
The resistance of the contact rods was measured with a multimeter and the results are in line with the calculations done above: The 6 left rods have a high resistance, the 9 right rods have low resistance.
Thermal variation
Why do the silent keys play again if they are held pressed for about one minute? To answer this question, we want to measure voltages at three points in time:
-
When the piano is turned on fresh and the key is silent
-
After some seconds of press and hold and key is still silent
-
After about a minute of press and hold, and they key plays as normal
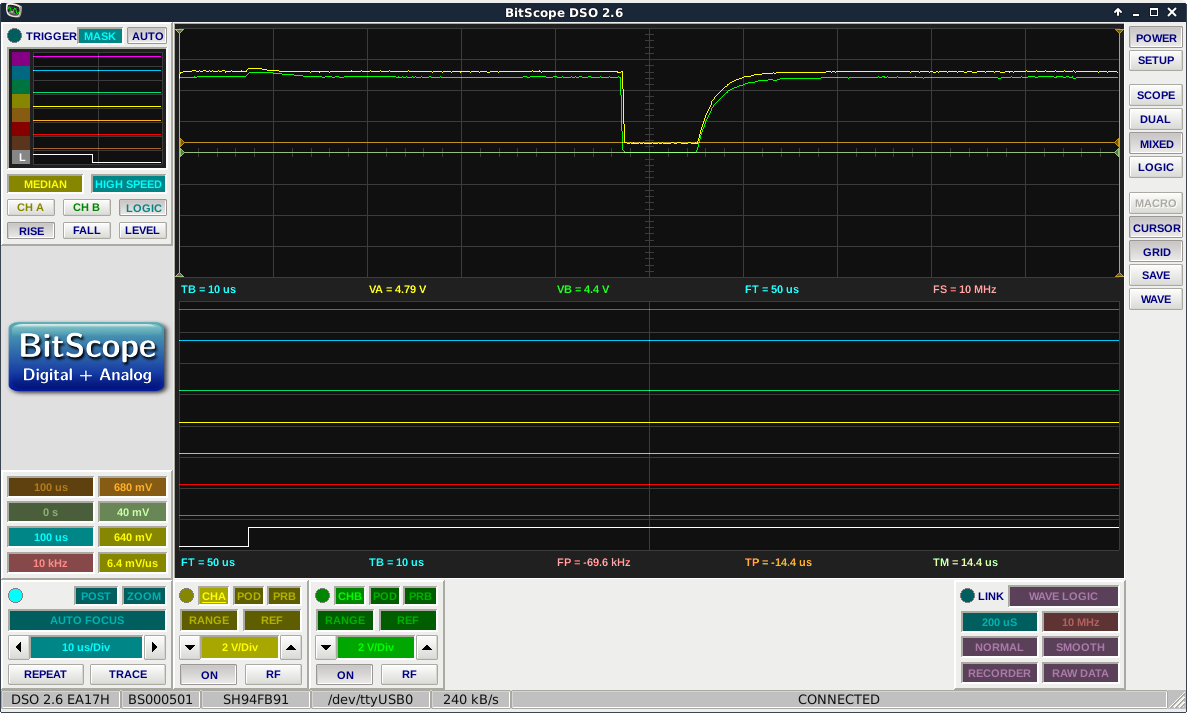
Two more traces were done for the E1 key, and the three traces are merged in this picture, click on it to watch the animation:
These are the readings:
| Measurement | Va | Vb | Vf | I [mA] | R |
|---|---|---|---|---|---|
| Cold, silent | 2.36 | 1.50 | 0.860 | 0.264 | 5,682 |
| Warming, silent | 2.46 | 1.74 | 0.720 | 0.254 | 6,850 |
| Warm, plays | 2.28 | 1.74 | 0.540 | 0.272 | 6,397 |
The sequence shows a decrease in the voltage in the diode and an increase in the switch resistance, due to an increase in their internal temperature, caused by the current circulating through them.
Vf decreases 320mV while Vb increases 240m, with the net result that Va is decreased 80mV,enough for it be read as a logical 0 as expected.
Conclusions
The switch resistance and an estimated usage curve are shown below. We assume that keys at the center of the keyboard are used more often, keys at the ends of the keyboard are used less often.
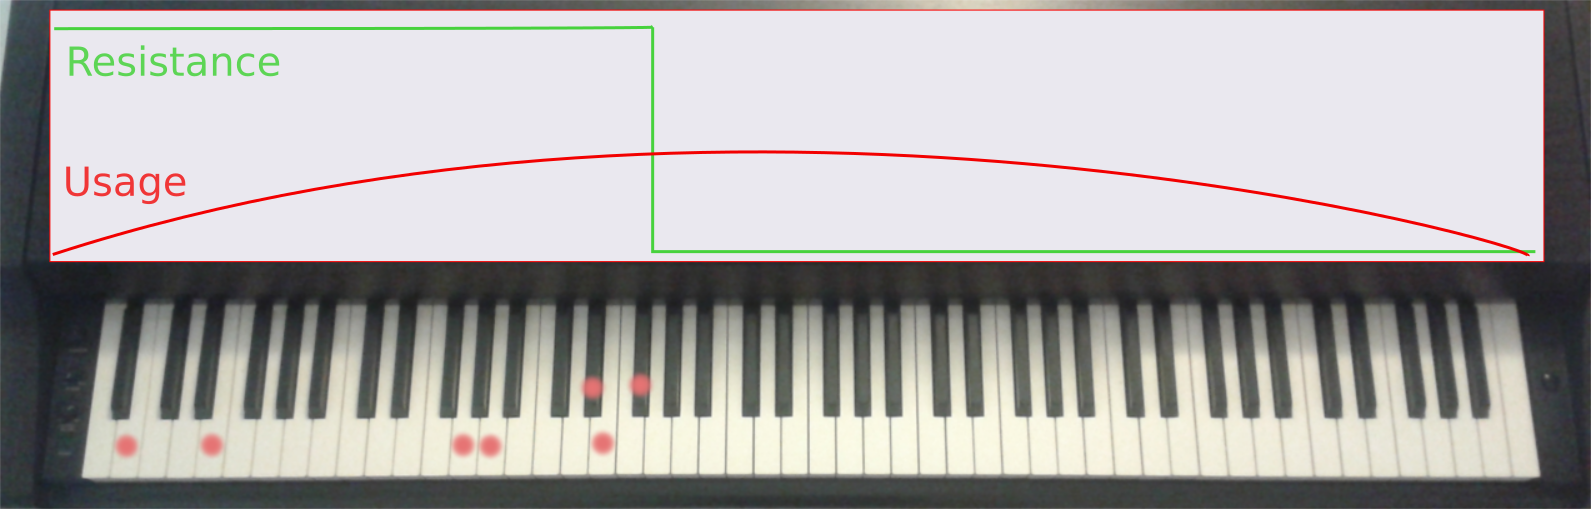
The picture shows that frequency of use is not a determinant factor: A0 and E1 are not the most used keys but they are silent often. Keys at the center of the keyboard are used often, but they have never failed. High resistance in the rubber contacts is clearly the factor that produces the silent key failure.
For further investigation
The analysis so far has explained us what is wrong, but not why. To answer this, we need to dig into these questions:
-
Is this a design issue? Was the difference in resistance for the first 6 rods versus the remaining 9 rods designed this way by the engineering team at Yamaha that worked on developing the product? I don’t think so. When the new rubber contact part arrives, I will check if it has resistance differences.
-
Is this a wear issue? Is the conductive coating in the silent keys more worn that in other keys? The silent keys like A0 and E1 that are used seldom, do not show marks of wear in the conductive coating of the contact bar, nor in the corresponding contact traces in the printed circuit board. I discard this as a cause.
-
Is this an aging issue? Does the conductive coating decay with time, increasing its resistance? Why only the first 6 rods increased the resistance, and not any of the remaining 9 rods? I find this difficult to justify.
-
Is this a manufacturing issue? Could a process deviation during the manufacture of the rubber contact strip, result in the conductive coating on the first 6 rods having a higher resistance up front? Wouldn’t this be tested and detected as part of the process? Could the process deviation result in part of the conductive coating aging faster? We would need more details about the manufacture process to investigate further.
-
Is this an interaction issue? Could the conductive material in the switch traces in the left printed circuit board cause changes in the conductive coating on those 6 contact rods? We need more details of the manufacturing process and the materials used to investigate further. After I replace the rubber contact with the new part I ordered, I will find out if the silent key failure appears again after months, which would support this hypothesis.
-
Is there an environmental factor? Could humidity, temperature and/or chemical agents in the air have affect the switches? Why could it only affect some rods and not the other ones? I will leave the old rubber contact on the open and check the resistance values over time. Will the low values in the right side increase if exposed directly to the environment?