Serial RLC Circuit
We will use a simulator to analyze the response over time of a simple series RLC circuit [1] with three components: R1, L1 and C1 and three nodes: 0, 1 and 2.
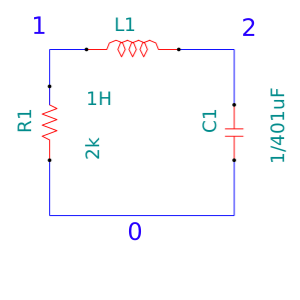
We want to know the value of the current i(t) in the circuit, starting with a current of 20mA and a voltage of 2V in the capacitor at time 0, and until 2 milliseconds.
Tools
These are tools that we will use and their purpose:
-
gnucap
-
Reads a
.ckttext file with the circuit definition, the simulation commands and the name of a.datoutput file. -
Performs the simulation and writes the results into the
.dattext file.
-
-
gnuplot
-
Reads a
.plttext file that includes the name of an input.datfile, the name of the output image.pngfile and the plot options. -
Reads the
.datfile and creates.pngoutput image file.
-
The circuit file
The first step is to manually create the text file serial-RLC.ckt
with this content:
Serial RLC circuit
*----------------------------------------------
R1 0 1 2k
L1 1 2 1 IC=2mA
C1 2 0 {1uF/401} IC=2V
*----------------------------------------------
.print transient i(R1)
.transient 0 .002 .000001 uic skip 30 > dat/serial-RLC.dat
The lines starting with * are comments, they are ignored. They help to separate these three parts of the file:
-
A title in the first row.
-
Three rows defining the network, each row has:
-
A letter and a number for the component: R1, L1, C1.
-
The numbers of the two nodes where the component is connected: 0 1, 1 2, 2 0.
-
The value of the device. Ohm, Henry or Farad units are assumed according to the device.
-
The initial conditions of IC=2mA in the inductor and IC=2V for the capacitor.
-
-
Two simulation commands:
-
.print specifies to include the current in the results file.
-
.transient specifies to simulate over time, starting at 0 seconds and ending in 2 miliseconds (.002 seconds). 30 calculations will be done every microsecond (.000001 and skip 30), the output will include one of every 30 results. uic means Include initial conditions.
-
The simulation
The following command runs the simulation:
gnucap -b serial-RLC.ckt
which produces the data file dat/serial-RLC.dat:
#Time       i(R1)
 0.         0.
 1.E-6      0.0019936
 2.E-6      0.0019864
 3.E-6      0.0019785
 4.E-6      0.0019697
 ...
 0.001997  -189.88E-6
 0.001998  -193.57E-6
 0.001999  -197.17E-6
 0.002     -200.69E-6
The file contains a row for each iteration of the simulation.
Making the graph
This command runs gnuplot:
gnuplot -s plt/serial-RLC.plt
which produces the image file png/serial-RLC.png
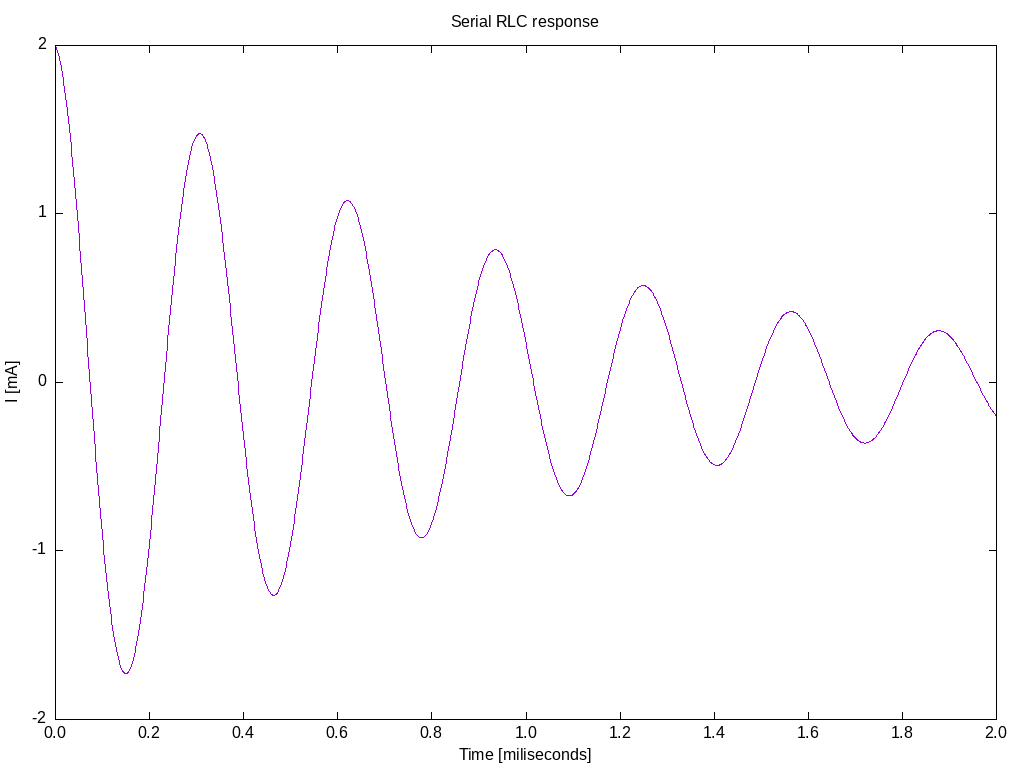
The result shows an underdamped response.
References
- The values for R, L and C are the same as in the example in Section 7-6 The source-free series RLC circuit, page 217 in Engineering Circuit Analysis, Hyat, William and Kemmerly, Jack, 1971